I was set a challenge a couple of months ago of calculating odds of playing a round without dropping a shot, and after a few hours of calculations I came up with some figures that I believe stand up to close scrutiny.
Before I tell you these odds, there are a few things that need to be pointed out.
There are two major variables in this calculation; the course and the ability of the player.
A par 72 course made up of 18 x 300 yard par 4s is going to be fairly easy to go round in without dropping a shot. Conversely, a course like Carnoustie, with it’s 470 yard par 4s and 246 yard par 3s is going to be incredibly difficult to go round in without dropping a shot. In fact, writing that last sentence inspired me to check the 2007 Open Championship results from Carnoustie, and there were only 8 out of 452 rounds played without a dropped shot – and that was the best players in the world and Carnoustie being fairly calm. (For reference, the 8 rounds were S. Garcia (round 3), H. Mahan (round 4), S. Stricker (round 3), P. Edberg (round 3), Z. Johnson (round 3), M. Calcavecchia (round 2), V. Singh (round 3), R McIlroy (round 1)).
The ability of the player is another key aspect. It’s fairly straightforward to assume that a scratch player has a much better chance of going around without dropping a shot than a 10 handicapper has.
The course I have used for calculating these odds in my home course, as it’s the only course that I have suitable data for. It is just over 6,500 yards, has 6 par 4s over 400 yards long (including a 467 yard beast), a 201 yard par 3, and a 556 yard par 5. The par and SSS are both 71. In terms of the “average” UK course, I would say that it is slightly harder than average.
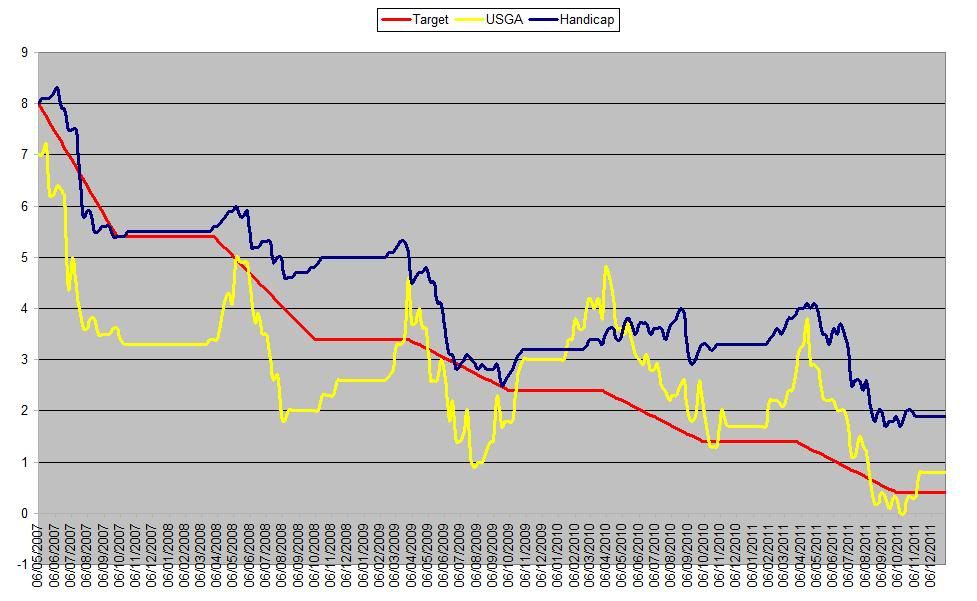
From the database that I keep which details every score for every hole since I started playing this course 3 years ago, I’ve split my rounds up by the handicap I had at the time of playing, and for each hole on the course looked at how many times I got par or better. I’m in a good starting position as I have played lots of rounds off of each handicap from 8 down to 3.
So that leaves me with a list values for each handicap (e.g. of my rounds as a 3 handicapper, hole 1 = 69% chance of par or better, hole 2 = 69% chance of par or better, hole 3 = 86% chance of par or better, and so on). Multiplying the values for all 18 holes gives me an overall percentage of getting par or better for each handicap. I’ve then rounded the figure for each handicap to take account of statistical anomalies.
Using these specific points meant that I could plot them on a graph, and find the formula for the curve that passes closest to all of these points.
The formula that best fitted these points was 146.34*(1.89229*POWER(x)), where x is the handicap. It gave an exponential graph as shown below;

Looking at the lower end of the scale in more focus, the graph is as below;

Using this curve and transposing the formula back to handicaps, the final odds are as follows;
Handicap Odds
-4 10/1
-3 21/1
-2 40/1
-1 76/1
0 145/1
1 276/1
2 523/1
3 991/1
4 1875/1
5 3550/1
6 6718/1
7 12713/1
8 24058/1
9 45526/1
10 86149/1
I am absolutely confident that these odds are as accurate as can possibly be generated at this moment in time. I’ve done lots of research, both in work and socially, and these figures stack up as much as any numbers I’ve ever calculated in the past.
There are other variables that need to be borne in mind when looking at these odds. These include, but are not limited to;
Weather conditions; most of the rounds on my database were in fairly good conditions
Tees used; my rounds are almost all from the back tees, if I played from the forward tees more often then the odds would reduce as the course would be easier
Par variance; I have gone on the basis that I am an ‘average’ player. Not in terms of ability, but in terms of how often I drop shots. For example, a player may go round in 3 over par, but that could include 17 pars and a triple bogey. Another player may also go round in 3 over par, but has had 6 birdies, 3 pars, and 9 bogeys. Player 1 has scored par or better on 17 holes, player 2 has only scored par or better on 9 holes. I believe that I am somewhere in the middle, and am therefore a representative example.
Realistic handicap; We all know that there are “good” 5 handicappers and “bad” 5 handicappers, this study is based on a realistic handicap, if your handicap is not realistic of your playing ability then these odds are not going to be accurate. This is a whole separate subject in its own right, and something I plan to write more about, including the inadequacies of the UK handicapping system, in more depth over the coming months.
So looking at the resultant odds, at the moment I have a 991/1 chance of completing 18 holes on my home course without dropping a shot. If I can get down to scratch then I reduce that to 145/1. Although not being a thing that is generally celebrated, I’d be much happier if I could frame a scorecard that contained no dropped shots than I would if I had a scorecard with a 1 on it.


No comments:
Post a Comment